How to configure thresholds for multiple interfaces?
You can configure thresholds for multiple interfaces of the same type by editing the relevant interface templates.
- Go to Admin-->Interface Templates page
- Click Edit icon corresponding the interface type.
- Modify the threshold.
- You can now apply the modified threshold to all interfaces of this type (say Ethernet), or apply to few chosen interfaces. You must select the appropriate option here to apply the threshold changes.
- Save and proceed to effect the new threshold configuration.
How to draw Layer 2 maps?
OpManager purely relies on SNMP to represent the connectivity of nodes and links in the network.
1. Configure a seed device : A seed device is the core switch in your network. The switch must have SNMP-enabled so that OpManager is able to query the device and draw the links automatically, showing the connectivity of all the devices on your network. As changes happen to the networks frequently, OpManager allows you to configure an interval (in days) to re-draw the map. For instance, if a change happens once in a week, you can configure OpManager to re-draw the map every seven days.
From the OpManager dashboard, select Maps --> Network Maps link (mouse-over the Maps tab to see the links to all the maps).
In the Networks Map, select Actions --> Settings menu to your right.
You will find a combo-box to select the seed device. Select the core switch from the list.
Select the topology layout from the layout combo-box.
Specify the interval (in days) at which the map must be re-drawn in the Sampling Interval field and click Submit.
The map is generated. You can change the layout by selecting the type as Radial Tree, Balloon Tree, Node Link or Custom option for the Layout combo-box on top of the network map. You can also export the map to Visio, or even save it as a business view in OpManager.
How to export Layer 2 maps to Visio?
Exporting to Visio
Prerequisites
Make sure you have Microsoft Visio 2007. Visio can be installed on any of your Windows devices and it need not be on the same server as OpManager. Ensure that you are able to access OpManager Weblcient from the machine where Visio is installed.
Installation
Download OpManager Add-in for Microsoft Visio from here.
Unzip the add-in download and extract the file ManageEngineOpManagerMicrosoftVisioAddin.msi.
Double-click the msi file to install the Add-in.
After successful installation, launch Visio and look for OpManager menu in the menubar. The add-in has installed properly if you find the menu!
Exporting Views from OpManager
Access OpManager webclient from the machine where MS Visio 2007 is installed.
You can export the map to Visio from the Network Maps link using Actions --> Export to Visio menu.
You can also export it from the business views using the Export to Visio button on top of the corresponding business view.
On exporting, you will be prompted to save the corresponding XML file with the name TopoMap.xml. Save the map in the desired location on that machine.
Loading the exported maps in Visio
From the Visio GUI, access OpManager --> Load Map menu from the menubar.
Browse and select the TopoMap.xml (you can rename the xml after you save it on the machine). The exported map will be loaded in Visio.
Make the desired changes and save. You can save the diagram as a vsd file or in standard Visio formats.
How to increase the field length of an alarm message?
To increase the size to say, 300 characters,
- Shut down OpManager Server.
- In the DatabaseSchema.conf, in addition to increasing the field length, change the data type from VARCHAR to TEXT.
- Connect to database using this command
C:\\..\\OpManager\\mysql\\bin>mysql.exe -u root -P 13306 OpManagerDB
- Modify the column in the database too by executing the following query from the SQL prompt:
ALTER table Alert modify MMESSAGE TEXT;
- Change the MAXIMUM_DBCOLUMN_LENGTH value in serverparameters.conf in /conf directory as: MAXIMUM_DBCOLUMN_LENGTH 300
- Restart OpManager Server
How to change timezone in OpManager?
To change the timezone in OpManager,
- Download the attached jar file and save it under /OpManager folder. [ rename the time.jar.txt file as time.jar ]
- Execute the following command:
- cmd> cd [OpManagerHome]
- cmd> jre\bin\java -cp time.jar Time
- The timezone as provided by this script output should be the same as your default time zone.
- If not, change the timezone to any other value using Date and Time Properties from the Control Panel.
- Reboot the server.
- Execute the commands as mentioned in step 2 above. The timezone by the script output should be the same as the value set.
- Reset the timezone to the original value.
- Reboot the server.
- Execute the commands as mentioned in step 2 above. The timezone by the script output should be the same as the value set.
How to increase the ping timeout?
For the all the
devices by default OpManager sends one packet with time out as 1 sec. So
if the WAN link stays busy, it is expected that OpManager will show that
the devices on the other side as down. You can resolve this problem by
increasing the ping time out, if needed even the packets sent to check
the availability. However this facility will be common for all the
device i.e. it is a global configuration.
Solution:
1. Edit the file \\OpManager\\conf\\Ping.properties
2.
Remove the "#" against "timeout=1" and Change the timeout value to 4.
This setting will make OpManager to wait for 4 seconds, if the device
did not respond.
3. If you wish to change the number of packets
sent to check the availability of the device, remove the "#" against
"count=" specify the desired number of packets to be sent to check the
availability.
4. Save and exit the file after the changes and Restart OpManager service for the changes to take effect.
How to move OpManager from trial to production server?
How to forward traps from OpManager?
Yet another frequently asked/discussed requirement is the ability to
forward alarms in OpManager as traps to another trap destination.
Requests are also raised to know if the incoming trap can be redirected
to another application. YES, both are possible. Here is how you go
about the forwarding:
Forwarding Traps
Here, OpManager simply forwards the SNMP Trap to another
manager/device. Forwarding traps from OpManager involves a couple of
configuration changes in two files. Refer the table below:
1. Effect the following configuration changes:
| File name & path |
Existing entry |
Modified entry |
/opmanager/conf/trap.forwarder |
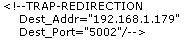
|
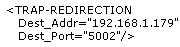
(replace with the correct
IP address and port)
|
| /opmanager/conf/trap.filters |
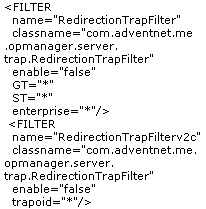
|
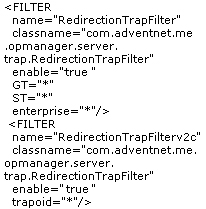
|
2. Save the file and restart OpManager.
OpManager starts forwarding the incoming traps to the destination IP address and the Port mentioned in the trap.forwarder file.
Forwarding OpManager Alarms as Traps
You might want to forward the alarms in OpManager as traps to another destination/trap receiver. Here is how you do it:
1)Ensure Net-SNMP is installed on the OpManager server or download from the links given at the end of this post:
2)Create a batch file sendtrap.bat to invoke the snmptrap command. Place this file in /opmanager folder. The syntax for this command is as follows:
snmptrap options hostname community trap parameters...
For Version 1, the required trap parameters are:
enterprise-oid agent trap-type specific-type uptime objectID type value...
The code snippet for this batch file is given below:
snmptrap -v 1 -c public %1 .1.3.6.7.2.1.3.1 %2 1 6 10000 .1.3.6.7.2.1.3.1.1.2 s "%3,%4,%5,%6"
where
| -v 1 |
The SNMP version |
| -c |
The community string and the default SNMP community string is public |
| %1 |
The manager name, viz., the hostname or the IP address of the manager that must receive traps. |
| .1.3.6.7.2.1.3.1 |
Specify the appropriate enterprise OID |
| %2 |
The agent-name, that is the hostname or the IP address of the device for which an alarm is generated. |
| .1.3.6.7.2.1.3.1.1.2 |
Replace with the appropriate specific OID |
| 1 |
The generic type number |
| 6 |
The specific type number |
| 10000 |
The sysUptime in milli-seconds |
| s |
Refers to the data type of the OID (string type) |
"%3,%4,%5,%6"
(replace the % symbol with $ if you are doing it on a Linux box) |
The message from OpManager that can contain one or more of the following variables:
- $displayName - the Displayname of the device
- $strModTime - the time when the alarm was generated
- $category - the category to which this device belongs to
- $severity - the severity of the alarm
- $message - the message of the alarm ( like Web Service Down or Threshold Violated ).
|
3)Configure a 'Run Program' notification profile specifying the following:
Command Name: sendtrap.bat
Program Arguments :[manager-name] $source $displayName $strModTime $category $severity $message
3. You can associate this notification profile to devices using the
Quick Configuration Wizard. Whenever an alarm is generated on the
managed devices, a trap is sent to the other monitoring server.
NET-SNMP download (zip)NET-SNMP download (exe)
How to monitor the services running in the secondary IP address of the server?
You can modify the IP Address to look at from the database, so that OpManager uses the secondary interface to monitor the service running on this interface alone.
Here is the procedure to do this.
1. Connect to mysql database using the following command:
cmd> cd [OpManagerHome]\\mysql\\bincmd> mysql.exe -u root -P 13306 OpManagerDB
2. Use the mysql update command to change the IP address to look at:
mysql> update InetService set TARGETADDRESS=1.2.3.4' where TARGETADDRESS='5.6.7.8';
1.2.3.4 is the secondary interface of the device5.6.7.8 is the primary interface of the device. OpManager should have discovered the device through this interface.
And update the TARGETADDRESS only for the interface on which a particular service runs.
Try using the following command :
mysql> update InetService set TARGETADDRESS='1.2.3.4' where TARGETADDRESS='5.6.7.8' and NAME='machine-name-or-ip-address_ServiceName_Portnumber';
where machine-name-or-ip-address refers to the machine name or ip address of the device to be monitored ( it is mostly the primary interface in case of ip address)
ServiceName is the name of the service to be monitored which can one among Web, FTP, Telnet, MySQL etc.. as specified under Admin -> Service Monitors
Portnumber is the port on which the service runs like 80, 21, 23, 3306 etc...
How to add custom WMI monitors in OpManager?
To add a custom monitor for a resource of a particular device type, the device template must be modified. The new monitor should be defined in the device template so that the monitor is associated for all devices of that type. Here are the steps.
- Go to Admin --> Device Templates.
- Select the template in which you want to add a new monitor. Eg: Windows XP (Click the letter W to display templates starting with this letter).
- From here, click any template. Example -Windows XP. Scroll down the template and click Add Monitors under Monitors column.
- Click the New Monitor --> WMI link in this page.
- Select a device name that OpManager can query. OpManager executes a WMI query on the device and checks the response.
- Specify the WMI credential to be used for that device. OpManager needs to authenticate itself to the device using the WMI credential specified.
- Configure the interval at which the resource should be monitored and click Next.
- Select the WMI Class to list the performance counters present in that WMI Class.
- Select the Performance counters and the instances (the instances are also listed here) that require monitoring and click on OK. The monitors are added to the template.
- Click on Apply to apply this template to the required Windows devices.
Note: While selecting the WMI class, current value shown on mouse over is the raw data and it is NOT the value calculated using the appropriate counter type of the WMI performance counter.Upon associating to devices, counter values will be calculated based upon the counter types.
How to change an interface as a WAN Interface in OpManager?
BY default these are the list of interface types( type number and name) which are considered as WAN interfaces inside OpManager.
18 DS1
20 Basic ISDN
21 Primary ISDN
22 Serial
23 PPP
32 Frame Relay DTE
33 RS-232
37 ATM
44 Frame Relay DCE
45 V35
49 AAL5
63 ISDN
64 V11
94 ADSL
96 SDSL
166 MPLS
To include any other type of Interface as a WAN interface to get SLA dashboard "WAN links by availability" report, we need to add the specific type into a table called "WANINTFTYPES"
For example to add an Ethernet/Fast Ethernet (which is of type 6) as a WAN interface, connect to the DB and run this query:
To connect to the Database (Mysql):
1) Open the command prompt
2) Go to the Mysql\bin directory and type the following
\\OpManager\mysql\bin>mysql -u root -P 13306 opmanagerdb
3) execute the following statement
4) mysql > insert into wanintftypes values(6);
5)exit
Stop and Start Opmanager and generate the report for Wan links . You can see all the Ethernet interfaces included in the report.
How to configure receiving of traps from the source router when monitoring WAN links?To receive alerts from the device, make sure you configure the routers to send traps to OpManager (you will not receive alerts from the device if the trap host is not configured in the source router). Telnet the router and type the following command:
 Uploading ....